
James Webb Space Telescope
Investigating the early universe, star formation and planetary atmospheres with infrared light.
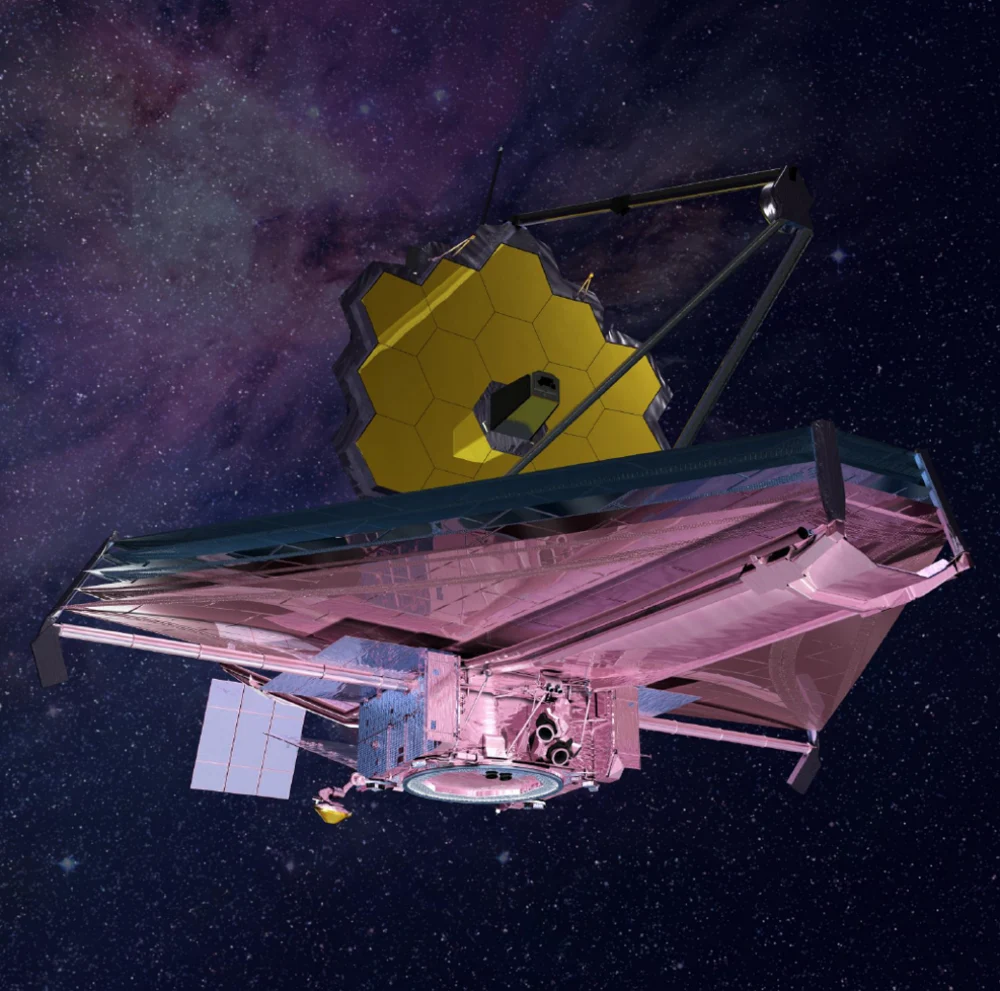
Webb is an infrared space observatory developed through NASA, ESA and CSA cooperation. It launched on 25 December 2021. Distant galaxies, star-forming regions and exoplanet atmospheres can be studied in different programmes using the same telescope. Each programme requires measurements and analysis appropriate to its target.
- Launch
- 25 December 2021
- Spectrum
- Near- and mid-infrared
- Partners
- NASA · ESA · CSA
01 / RESEARCH LAYER
Why choose infrared?
Infrared wavelengths help investigate cool objects and processes within dusty regions. Cosmic expansion shifts light from distant sources towards longer wavelengths. A galaxy’s red appearance alone does not measure distance; filters, spectra and model comparisons are needed.
02 / RESEARCH LAYER
Mirror, sunshield and detector
The segmented primary mirror collects light; the sunshield supports a cold operating environment. Imaging and spectroscopy serve different scientific requirements. An orbit around the Sun–Earth L2 region places Webb somewhere different from Hubble’s Earth orbit.
03 / RESEARCH LAYER
Reading colours as a data map
Infrared measurements are assigned visible colours for presentation. These need not reproduce what an unaided human eye would see from the same location. Filter information and source explanations connect a beautiful image with physical interpretation.
04 / RESEARCH LAYER
What does an atmospheric signal prove?
A molecule’s spectral signature is an important finding about a planetary atmosphere. One chemical constituent is not evidence of life. Clouds, stellar activity, measurement noise and model assumptions must be considered with the result. Independent archive analyses help test how robust inferences are.
05 / RESEARCH LAYER
Describing what you see in a spectrum
First identify whether the horizontal axis is wavelength or frequency, then determine the vertical quantity and units. Examine error bars and instrument coverage before naming a dip or peak. Comparing a molecule’s expected signatures at several wavelengths is stronger than relying on one point. This reading habit preserves the impact of a scientific visual while distinguishing observation from model-derived interpretation.
CONNECTED INVESTIGATIONS
Where can you go from this dossier?
GO TO THE SOURCE
Turn reading into research.
Editorial review: . Mission status and catalogues can change; consult the official source for current information.
Image: NASA / Adriana Manrique Gutierrez · Artist’s impression of Webb.