
SPACETRC / SATELLITE & ATMOSPHERE
Our atmosphere.
A changing planet.
From Türkiye to the wider world, explore clouds and atmospheric products through satellite observations. Choose a product, check its observation time and follow change with source-linked imagery.
OBSERVATION CONSOLE
Choose a region.
Explore different channels.
Data and imagery are requested from the provider when you start. The source and product explanations below remain readable at all times.
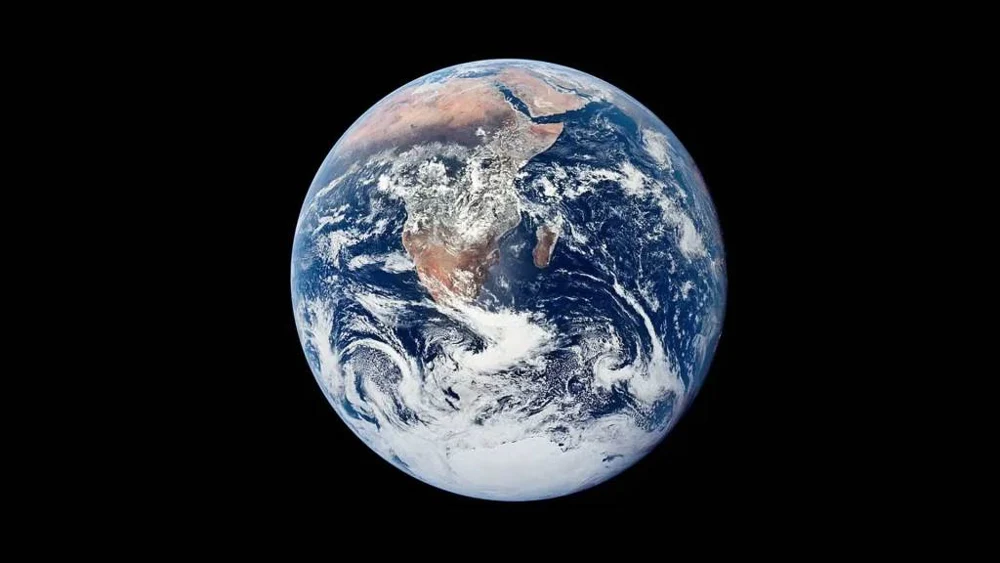
Start to load a dated satellite image of your chosen region here.
Playback sequences images acquired at separate times. It does not depict motion at real-time speed.
- Observation time / UTC
- Source retrieval time / UTC
- Observation age
- Freshness / data status
- Product resolution
- Observation coverage
Read the colour, unit and source together.
The legend follows the selected product. RGB composite colours and the colours of a numerical atmospheric product do not mean the same thing.
Open the official imagery source ↗FROM IMAGE TO UNDERSTANDING
Every product asks a different question.
Clouds and infrared
Visible channels observe reflected sunlight; infrared channels observe thermal radiation. A coloured composite differs from a photograph. Brightness temperature does not always represent air temperature at ground level.
Water vapour
Check which atmospheric layer or total column the product represents. A satellite water-vapour image does not replace a measurement of relative humidity at your location.
Aerosols
Optical depth describes light interaction through an atmospheric column. Clouds and data gaps affect interpretation. This view does not directly calculate ground-level PM2.5 or an air-quality index.
City lights in the nighttime GeoColour view are a static background, not a current measurement of illumination. Interpret the current cloud observation separately from that background. GeoColour: EUMETSAT / NASA · CC BY 4.0.
INTERPRET THE OBSERVATION
Time first.
Then coverage and method.
Compare the same region and product at comparable times. A difference in one image does not establish a climate trend or storm forecast. An imagery gap does not mean clear sky.
- Separate the timestampsObservation, processing, publication and this page’s retrieval can occur at different times.
- Check the coverageSensors do not view the entire Earth or every time interval at the same level of detail.
- Open the sourceRead the product definition, unit, colour scale and missing-data explanation together.
OPEN SOURCES / FURTHER EXPLORATION
Follow the observation to its source.
We acknowledge the use of imagery provided by NASA GIBS, part of ESDIS. EUMETSAT and other provider credits accompany the selected product. Source links do not imply an institutional partnership.
This workspace presents dated satellite observations for scientific exploration and learning; it does not generate weather forecasts. Editorial review: 24 October 2026.